Thursday, May 31, 2007

Why the scientific publishing system sucks the big hairy dog, part 2 of X

I spent a good part of Saturday in at work trying to look up some papers referenced by this article I’m trying to review. I eventually figured out that our university no longer has the paper copies of Philosophical Magazine B, while the electronic subscription does not cover the early 90’s, so I was SOL. At the time, I was tempted to write a huge angry rant about this, since the one thing that the blogosphere is desperately short on is long, angry rants. But in time, cooler heads prevailed, so I decided to change angles and make a meme out of it. ‘cause the internet needs more memes.

So here you go folks:
The library adequacy meme:

This meme takes a little bit longer than the ones designed to determine your romantic compatibility or psychological similarities to dead white people, but it will hopefully be more informative as well.

Grab the nearest paper handy to your desk that is not written by you. Flip to the first page of references.

Look up each reference on your library system (Those of you in the real world can do a predetermined subset if you lack infinite time).
Of those references,
-How many are available electronically?
-How many are available locally on paper?
-How many are not available, but are in your personal stash (paper or electronic)?
-How many of those papers do you not have access to?

Since I blog from home, the answer for me is obviously 0/0/0/100% at the moment, but I’ll give it a go when I check the references for this review and plug the numbers in.

Wednesday, May 30, 2007

Post-docs with students

Is this like the academic equivalent of teen-age pregnancy?

Sunday, May 27, 2007

Why the scientific publishing system sucks the big hairy dog, part 1 of X

My contract is coming up for review, so I’m updating my CV. This includes looking up papers and abstract I’m on and getting the references. So I go to a major university–based publishing house’s website to check one of these references- an abstract that I’m last author on, and never actually got a copy of. Since I’m at home (it is Sunday night here), I obviously don’t have journal access, but that’s OK. All I need is the reference. So I click the “save citation” button, and guess what happens. Do I get the correct reference, in a handy format? As if. Instead I get directed to the login page. I don’t want the article, I don’t want the abstract, all I want is the frigging reference, but those tight-fisted English wankers won’t even give that out without the coin of the realm. I ended up cutting and pasting the author list, title, and reference text from the index page separately. Hopefully that is all the info I need (it looks complete), so I have what I need to know, but still. Asking for $$ (or pounds, or blood) just to get the citation information all in one piece is beyond stingy; it makes Mr. Scrooge look like a philanthropist.

Show us your lab!

Sara has tagged the lab rodents of the world into posting pictures of their dens. Here's mine:


I won't name names either, but feel free to join in.

Saturday, May 26, 2007

Mercury spotting guide

Mercury is the only planet closer than Uranus never to be orbited by a spacecraft. Mariner 10 did a couple of flybys back in the 70’s, but those only managed to image about 45% of the surface, and the proximity of the planet to the sun means that space-based telescopes have been unable to take pictures. As a result, there is surprisingly little good remote sensing data for this planet, despite its being known since antiquity.

Luckily, this is scheduled to change. The NASA MESSENGER spacecraft is due to orbit Mercury in 2011. Like Pluto, Mercury has an eccentric orbit that is inclined from the ecliptic- the plane in which that the other 7 orbit. As a result, the spacecraft will require numerous gravity assists in order to match velocity closely enough to insert itself into orbit. Since the second Venus flyby is happening in just over a week, this is an opportune time to address some of the basics of this planet.

The most basic information about a planet is its location. It is difficult to study a planet without finding it first, so here is a handy, step-by-step guide for how to find Mercury for the next 2-3 weeks.

1. Find a clear, unobstructed view of the western horizon.
2. Just after sunset, watch the stars come out, admire the incredible brightness of Venus, and wait until the sky is dark enough for the main seven stars of Orion appear.
3. Draw an imaginary line from Rigel to Bellatrix. Continue along this line for one and a quarter times its length. As of tonight, Mercury lies at the end of that line. An annotated photo that I took this evening is below (click to enlarge):


Over the next two weeks, Mercury will get higher in the sky, so that by June 6 or so, you will need a line between Rigel and Betelgeuse, not Bellatrix. At this point, it will be at its highest point in the sky, with a visual magnitude similar to Betelgeuse.

After that, it will hang in the sky for a few days before quickly dimming and dropping away. By mid June, Orion will be getting difficult to spot before sunset as well.

Note that northern hemisphere viewers may find that Rigel sets before the sky gets dark enough to see it. Y’all may need a different spotting method.

Wednesday, May 23, 2007

Paper out

Birch, W. D., Barron, L. M., Magee, C. and Sutherland, F. L. , 'Gold- and diamond-bearing White Hills Gravel, St Arnaud district, Victoria: age and provenance based on U - Pb dating of zircon and rutile', Australian Journal of Earth Sciences, 54:4, 609 - 628

Abstract: Investigation of coarse (42 mm) heavy-mineral concentrates from the White Hills Gravel near St Arnaud in western Victoria provides new evidence for the age and provenance of this widespread palaeoplacer formation. A prominent zircon – sapphire – spinel assemblage is characteristic of Cenozoic basaltic-derived gemfields in eastern Australia, while a single diamond shows similar features to others found in alluvial deposits in northeastern Victoria and New South Wales. Dating of two suites of zircons by fission track and U– Pb (SHRIMP) methods gave overlapping ages between 67.4+5.2 and 74.5+6.3 Ma, indicating a maximum age of Late Cretaceous for the formation. Another suite of minerals includes tourmaline (schorl – dravite), andalusite, rutile and anatase, which are probably locally derived from contact metamorphic aureoles in Cambro-Ordovician basement metapelites intruded by Early Devonian granites. U – Pb dating of rutile grains by laser ablation ICPMS gave an age of 393+10 Ma, confirming an Early Devonian age for the regional granites and associated contact metamorphism. Other phases present include pseudorutile, metamorphic corundum of various types, maghemite and hematite, which have more equivocal source rocks. A model to explain the diverse sources of these minerals invokes recycling and mixing of the far-travelled basalt-derived suite with the less mature, locally derived metamorphic suite. Some minerals have probably been recycled from Mesozoic gravels through Early Cenozoic (Paleocene – Eocene) drainage systems during various episodes of weathering, ferruginisation and erosion. Comparison between heavy-mineral assemblages in occurrences of the White Hills Gravel may allow distinction between depositional models advocating either separate drainage networks or coalescing sheets. Such assemblages may also provide evidence for the present-day divide in the Western Uplands being the youngest expression of an old (Late Mesozoic – Early Cenozoic) stable divide separating north- and south-flowing streams or a much younger feature (ca 10 Ma) which disrupted mainly south-flowing drainage.

I did the rutile U/Pb, most of the zircon U/Pb, and the rutile trace element analysis and interpretation. So if anyone out there has hard core stratigraphy questions, I'll have to pass them on to Bill.

I can't actually link my own paper from home, so anyone interested will have to look it up the old fashioned way.

Sunday, May 20, 2007

Space Station and Venus

The bad astronomer recently exhibited a picture, taken from the surface of the Earth, of the space station and the planet Venus together in the sky. Due to distances and atmospheric distortion, the details of both the planet and the station were difficult to discern.

Fortunately, here at the Lemming Laboratories, we have managed to scrounge up the temporary use of a space telescope. As a result, we were able to take a similar picture of a space station / Venus conjunction, only with much higher magnification and with more visible detail. That picture is shown below. As you can see, both objects are clearly visible, as are some of the details of the planet’s clouds and the station’s trunk. Enjoy.

Tuesday, May 15, 2007

Uranium Thorium dating of stars

Here at the lounge, we tend to follow the lemming pack in believing that when it comes to U decay chain dating, smaller is better. Smaller blanks, smaller spots, miniaturization is the name of the game. So imagine my surprise when I read that somebody had done astrogeochronology on an entire star!

The paper, and some related lecture notes are available on the web, so I had a look, and this is my best attempt at an explanation:

Anna Frebel and colleagues are interested in primitive stars- stars which have few metals (metal=anything heavier than He) in them. This is also useful because there is an Fe interference on the best U peak. There are also C-N molecular interferences. However, in their star survey they found a star with low Fe, low C, and R-process enrichment. (The R process is the nucleosynthetic process that produces U).

What they do is to calculate the expected initial U and Th production based on one of the other stable R process elements they observed (Os, Ir, Eu). They then assume the deficit between measured and expected Th and U is due to radioactive decay at the standard rate.

They get a mean age of about 13.2 Ga, +/- around 2.5 Ga, depending on how the errors are crunched. For the Th, the main source of error was the model of the initial concentration; for the U the main error was in the measurements.

Obviously, there is still work to be done. It would be easy for sub-permil U/Pb hotshots to rubbish this work, but considering what the first U/Pb dates from the 1920's were like, I reckon this is a pretty good number. And it should only get better.
The different results from different reference elements means that either they need to model R vs S abundances of the reference elements, or that the theoretical R values are wrong for the supernova(e) that generated the heavy elements in this star. But as an analysis, this looks like a good enough result to put the modelers and theoreticians on the back foot.

Hat tip: Bad Astronomer.

Monday, May 14, 2007

Birth of Earth miniseries

Evelyn at skepchick has posted a five part description of the formation of the Earth, complete with references.
Part 1 nucleosynthesis and the formation of elements.
Part 2 composition of the Earth and solar nebula.
Part 3 Meteorites and accretion.
Part 4 Differentiation, core formation, heat production.
Part 5 Moon, Magma, Mantle.

I've been meaning to do something like this for months, but linking is so much easier.

Alkali background banishment

When I started this project, the background count rates for the alkali, in ppm equivalets, were:
Li: 87
Na: 623
Rb: 0.090
Cs: 0.037

After a year of belittling the backgrounds, the machine can now generally achieve:
Li: 0.5
Na: 161
Rb: 0.022
Cs: 0.005

I'd say that result is good enough for a conference in New Zealand. I'm going to bed now.

Sunday, May 13, 2007

Poster or Talk?

Which do you prefer? Which is more work? Which is more rewarding?

I used to think that posters were way more labor intensive, but I realized today that for all my previous talk, I already had figures that I just needed to slot into the talk. Having to make them up from the data just for the talk is significantly more effort.

So I don't have time to present more detailed argument for and against each format; I still have a dozen slides to finsih tonight.

Thursday, May 10, 2007

Red tape can damage labs

The university bureaucracy threatened to damage my lab recently. We use an excimer laser to generate the UV laser light used in our laser ablation system. Like most excimer lasers, this unit contains fluorine gas, and this gas is purified by circulating it through a liquid nitrogen cold trap. If the cold trap warms up during laser operation, damage to the internal components is possible, and damage to the windows of the resonator is likely.

I recently had a professor who was using the instrument get stuck in a meeting for so long that the cold trap, which is designed to hold 6-8 hours of LN2, ran dry, putting the laser at risk.

Now, I realize that senior academics do need to communicate with each other. And I know that sometimes the timing of these meetings can have a much higher relative error than, say, the age of the Earth. But still. If a meeting is going to run hours and hours over time, have a thought for the direct consequences of keeping people tied up, in addition to the lost productivity, disenchantment, etc. I wouldn’t be so foolish to ask admin to buy us new mirrors- my money is better spent on lottery tickets. But giving researchers enough time to temporarily tread water would be nice.

Wednesday, May 09, 2007

I split a moon beam

Here’s the last of my CD spectrometer pictures. The following is the full moon.


I’m pretty sure the gap where yellow should be is a result of the detector having a green-red gap, and is not actually in the moonlight.

Eli seemed to be having fun picking mercury spectra out of my various pictures, so I figured I’d give him this to chew on.


And finally, the reason I gave up on this: I know when I’ve been thoroughly outclassed. A teenager in Oklahoma built a Raman spectrometer, at home, on a tiny budget, to win this prize.

Anyone looking for the spectra of various household light sources should check here.

Saturday, May 05, 2007

Free lightbulbs at Bunnings

The Belconnen Bunnings is giving away free compact fluorescent lightbulbs as part of an energy conservation scheme funded by the NSW and ACT governments.

Seems like a good idea. As much as we science bloggers love to think that all of humanity is clamouring to hear more about how everything works, our my sitelogs suggest that this may not be the case.

Fact is, most people aren’t that interested in how lightbulbs work. As such, they probably aren’t going to go out and spend an extra 6 bucks on a bulb that looks like an electrocuted pretzel. But if you give away enough bulbs to make a dent in their energy bill, then they are much more likely to be converted. So, for both of you local readers, here’s the deal: you can get a sixpack of compact fluoros at Bunnings for free this weekend.

Friday, May 04, 2007

Antarctic ice dynamics

Thursday seminar was by Dr. Paul Tregoning this week, titled “The melting of Antarctica and rising sea levels: What do we really know?” I will try to summarize, but since it is mostly geophysics, it will be a simplified explanation. Never-the-less, there are important lessons from the talk about how we know what we know, and where limitations of knowledge come from.

But first, a basic geophysics refresher: Isostacy.

Unlike the smaller, deader terrestrial bodies in our solar system, the Earth has a weak lithosphere. This means that if you put a large weight (like an ice sheet) anywhere on Earth, the weight will deform the planet. Specifically, the weight will sink, and displace the underlying mantle, until the total mass where the ice sheet is equals the mass everywhere else. This even distribution of mass around the planet is known as isostatic equilibrium, and if rapid changes on mass occur (e.g. an ice cap melts), the mantle will flow to achieve a new equilibrium.


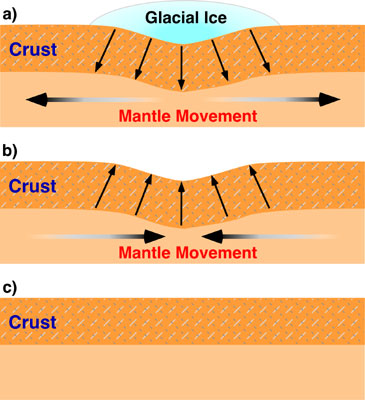
Figure from http://www.physicalgeography.net/

The problem is, the mantle doesn’t flow very quickly, being solid rock and all, so it takes tens of thousands of years to reach equilibrium. In fact, areas that were heavily glaciated during the last ice age are still rebounding today.

Back to Antarctica.

The talk focused only on current ice trends, and only on Antarctica, not Greenland. In Antarctica, there are two main satellite methods used to look at the ice volume. Altimetry, which measures the distance of the top of the snowpack to a satellite in known orbit, and gravity, which measures the total mass change of the ice sheet.

In both cases, the measurements are not straight forward. Altimetry measurements are dependent on snow thickness, freshness, slopes, etc. Gravity measurements appear to be dominated by artifacts, and various researchers are not in agreement on how to make sense of the data.

Satellite data analysis was not the focus of the talk, but he did mention that there was a French approach and an American approach- the French used an empirical noise reduction that the Americans claim has no rigorous basis, and the Americans use a Gaussian technique that the French think removes signal along with the noise.

No matter which technique you use, the gravity data shows mass loss in coastal West Antarctica (Marie Byrd Land), and mass gain in Enderby land and the Zumberge coast region of SE West Antarctica. And that’s where things got interesting.

Everyone agrees that the mass loss in coastal Marie Byrd Land is ice loss- the only argument is whether it is increased ice flow/melting or drought (reduced snowfall). But there are two possible explanations for the mass gain in the other two locations. One is that snowfall has increased, so the ice mass is increasing there. The other possibility is isostatic rebound.


Although Antarctica is still glaciated, in some parts the glaciers are thinner now that they were during the last ice age. Thus, rebound is a possibility. And because the mantle is 3.6 times denser than ice, you need a lot less rebound to get the same gravity signal. And various modelers suggest that the rebound signal could be between 80% and 120% of the ice mass signal. But there are a few problems.

Firstly, there are very few points where the rebound history of Antarctica can be measured, because most of it is still under ice. The Scandinavian ice sheet has hundreds of paleoshorelines that can be used to construct a rebound history. Antarctica- which is larger than all of Europe- has lass than a dozen good sites.

Furthermore, attempts to calculate what the ice thickness of Antarctica was at the Last Glacial Maximum are similarly vague- most of them consist of taking the total sea level change, subtracting out the comparatively well known Northern Hemisphere ice volumes, and assuming that most of the rest of the missing water mass must have been ice in Antarctica- somewhere. And many recent field studies seem to complicate many accepted models of where that extra Antarctic ice could be stashed.

In the case of the Zumberge area, consensus seems to be that it is isostatic rebound that is causing the mass gain. But in the case of Enderby Land, it could be either. So this last summer field season, they put in a remote GPS station to get ground-truth data on whether or not the bedrock is rebounding. If there is significant rebound, then there may not be any substantial precipitation gain to offset the ice loss from West Antarctica. If there is no rebound, then the net mass loss from the Antarctic ice sheet could be considerably smaller. It takes about a year or two for a GPS station to get enough precision to determine uplift rates needed to constrain this data.

Overall, it was a very good talk, with the speaking being exceptionally careful to explain where various constraints came from, and how we know what we know (or don’t know). And he did a great job of not getting drawn into unrigorous extrapolation or editorializing during the question and answer session.

Wednesday, May 02, 2007

Question about reviewing etiquette

I am currently reviewing a paper. The experiment and results are great, this discussion is pretty good, but there is one fairly serious problem. A lot of the writing is terrible. The sentence construction is not what English speakers would consider to be correct. Several parts, especially in the intro and discussion, are really quite hard to read.

None of the authors are native English speakers. Neither is the handling editor. As any of you who are regular readers must know, tact is not one of my strong points. So I was wondering if any of y’all have tips as to the best way to address English language problems in the review process.

Should I print out a second copy just to “annotate” for readability?
At what point do annotations become too dense to be legible?
At what point does reviewing turn into rewriting, and where in that continuum do toes get stepped on?

What other options are there?