Monday, March 29, 2010

Dune-flood interactions


The pathological geomorphologists have been running a series on dune-river interactions recently, so I wanted to add this most recent TERRA image of the Queensland floods. The floodwaters in the Diamantina (top) and Coopers Creek (above centre) sections have now reached the longitudinal dunes of the Simpson desert. The full image has 250 meter pixel size, so it is easy to see individual dunes (which are generally a few hundred meters across the base and a few to tens of km apart). You will have to click the link for super high res goodness and detail- clicking the image only gives a medium resolution image.
These images are updated daily (weather permitting), so you can hop backwards and forwards to measure the progress of the flooding over the past month or so.

Sunday, March 28, 2010

What am I doing right now?

This is the accretionary wedge question of the month. It relates to our jobs as professional geoscientists. However, geologists are humans too. And we have all the complications and work-life interactions that constrain other humans. So right now, the answer to this question is very simple:

I am on paternity leave. I've put my isotopic ratios and crystal chemistry aside for now, to care for LLLL-Y, a little man who is about 1010 times younger than your average zircon. This involves changing nappies, settling, and generally attending to any extraneous needs of his that don't require boobs. When I'm not doing that, LLLL-X still requires all the love and attention that she took for granted three weeks ago.

The zircons have been sitting around dutifully trapping the daughter products of actinide decay for hundreds of millions of years. They can wait until next week.

Floods from space


NASA's Earth Observatory has been posting some great pictures of the Queensland floods. East-Central Australia's ephemeral rivers have very low gradients, so floods can be tens of kilometers wide while being only a few meters deep. Using the correct spectral band, this standing water is easily visible from space. The flooded rivers in the above picture are (from West to East) The Georgina and Diamantina rivers, which flow together in Northern South Australia before entering Lake Eyre; Coopers Creek, which independently enters Lake Eyre, The Bulloo River, which is a closed drainage all of its own; and the various tributaries of the Darling, which runs south into the Murray river and eventually into the Great Australian Bight.

The Earth Observatory has a page showing a series of images from both this and previous floods.

When I was in exploration, we had a few tenements in Western Queensland. We were lucky enough to work some areas after moderate rain events, and got to see what happens when these places fill up with water. The following images are from the Georgina basin, and show how the Eastern Simpson desert changes with rain.

The characteristic longitudinal dunes are present in all
images, as low lines of orange sand (often overgrown).


When dry, there isn't much there aside from spinifex, mallee scrub, and arid animals (which are interesting in their own right).


When it rains, though, the waterbirds are spectacular. These are brolgas, but we also saw ducks, herons, gulls, and all sorts of other things which I can't identify.

The Real Dirt has this report on flooding of the Mulligan river, a Georgina tributary near where the above "dry" photo was taken (We had the uranium exploration rights to parts of their nature reserves). It is well worth reading.

Update: The most recent image is here.

Wednesday, March 24, 2010

Ozone as a greenhouse gas

There is a malicious rumor stalking the geocybersphere that overworked professors, desperate not to be seen using wikipedia as a source, have decided to grading-related research using twitter. As a twit-free blogger, I am not in a position to determine the veracity of these reports, but a little birdie told me that non-climatologist rockheads were looking for information on the greenhouse gas properties of ozone.

Ozone absorbs IR in a portion of the spectra that is generally not absorbed by many other gasses (figure 1, figure 2), and thus is a greenhouse gas. More importantly for those of us who have given up on this planet and are looking for the next best thing, the ozone IR peak is considered to be a prime candidate for exobiological IR spectroscopy, which will be great once we find a terrestrial planet cool enough to host water.

figure 1: Ozone FTIR spectra (from here).
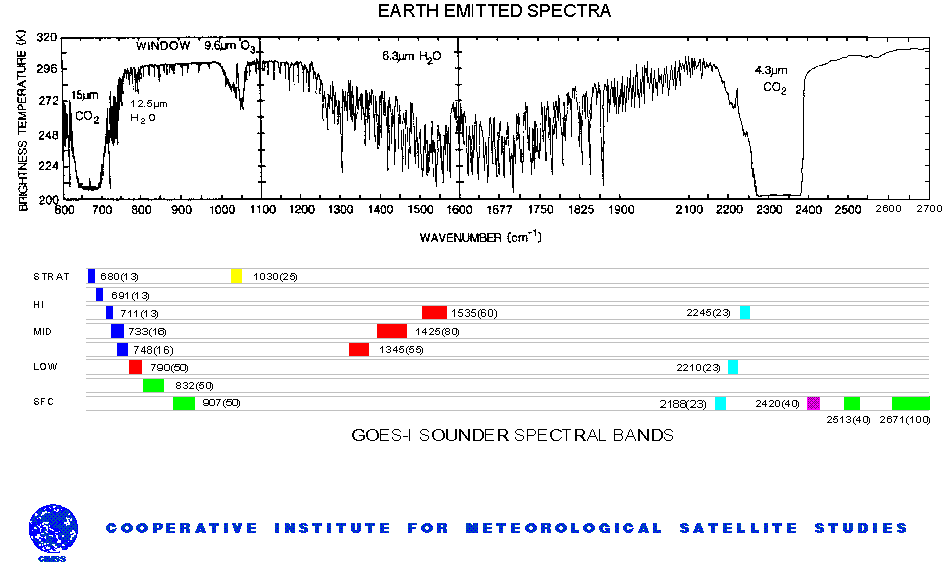
Figure 2. Terrestrial IR emittance. Valleys indicate atmospheric adsorbtion. Note that O3, H2O, and CO2 have very different atmospheric abundances. click image for more readable version. From here.

In the mean time, the effects of ozone on the radiation balance of this washed-up blue dot are available in a source only slightly less controvercial than twitter or wikipedia:
The IPCC fourth assessment report.
Section 2.3.6.1 covers stratospheric ozone (the 'ozone layer').
Section 2.3.6.2 covers tropospheric ozone (smog & other air pollution ozone, incl. lightning).

The tropospheric ozone issue is complicated by the fact that most ozone-producing processes also produce CO and the various nitrous oxides (NOx). But the GHG contribution from tropospheric ozone appears to be moderate and positive (a mean estimated forcing of +0.35 W/m2, with asymmetrical error envelope of +0.25 to +0.65 W/m2)

The stratospheric ozone calculation is poorly explained. They don't actually give the total forcing of the pre-CFC (intact) ozone layer, the current one, and use the difference. Rather, they try to estimate the change in forcing directly, including the change in all the chemicals that cause ozone destruction (which are also GHG's). This is confusing, since those gasses were already addressed in section 2.3.4: Montreal Protocol Gasses. So the Montreal gasses (or at least the sink that is the ozone destruction reaction) appear to be counted twice. Their final estimate is that ozone depletion has had a cooling effect, with a forcing of -0.05 ± 0.1 W/m2.

Note that the baseline year for stratospheric ozone is 1979, which may or may not be appropriate for pre-industrial levels.

For some reason ozone is not listed in table 2.1, but based on these numbers, it should be somewhere between the 2nd and 5th most important gas in terms of total anthropogenic radiative forcing.

What I want to know (and is not addressed in this part of the IPCC report) is whether or not Antarctic ozone depletion is what has allowed that part of the planet to warm much more slowly than everywhere else over the past 30 years. Bueller?

(Addendum)
Paranoid readers may think that wanting to know the total forcing of the stratospheric ozone layer is a precursor to a mad geoengineering scheme that will eradicate all terrestrial life in exchange for 50 more years of coal profits. That is always an option, of course. But there is a far more interesting application relating to a much more exciting period of geologic time.

In the Neoproterozoic, atmospheric oxygen is thought to have increased rapidly as the ocean transitioned from anoxic at depth to entirely oxidized. Stratospheric ozone is formed from atmospheric oxygen. So I am wondering if the greenhouse contribution from a growing ozone layer would be strong enough to be a contributing factor to the end of the Cryogenean glaciations at the Ediacaran/Cryogenean boundary. Anyone have any idea if that's plausible?

Sunday, March 21, 2010

The Lake Eyre Yacht Club

Lake Eyre is the terminal playa for Australia's largest drainage system. Most of the time, it is a salt pan, with or without some briny pools at one end or the other. However, every few years, it floods to a few meters depth, and a few times a century it fills up. It's ephemeral nature does not prevent people from taking an interest in sailing there. The Lake Eyre Yacht Club has a website detailing information on the current lake status, tips for navigating on remote, supersaturated salt water, and everything else potential mariners might want to know. Geoscientists often justify their work in terms of disaster mitigation, economic activity, or other serious benefits. But this shows that the layman's ability to use geospacial data is limited only by his imagination. There's a huge amount of hydrology and remote sensing science that goes into trying to predict lake levels. But I doubt any of the scientists who built these tools imagined that they would be used for catamaraning in the middle of a desert.

Monday, March 15, 2010

Differential Healthcare wordles

Over at the political stats blog fivethirtyeight.com, guru Nate has wordled responses from a recent poll on Healthcare. While this is interesting, I don't think it is the best way to look at the data. So here are differential wordles for the For and Aganist responses.

Methodology


Cut responce text (unedited) out of spreadsheet and into text file, then into wordle. Get word frequencies, and copy/paste to excell. Eliminate common pronouns and prepositions. Cut off words with frequency less than 10. At this point, there were ~11% more against words than for words, so frequencies were normalized. Against words were reculled at 11, and normalization was redone (it changes by less than 2%). For and Against totals were subtracted from one another, and wordles were made from both sides for whichever had more of a given word.

Note that I have left many common words in to see if their frequency is different between the two camps.

Against:


For:


Against data:


wordagainst diff
ABLE0
ABORTION13
ABOUT13
ACCESS0
AFFORD0
AFFORDABLE0
ALL0
ANY0
ANYTHING15
ARE0
AS0
AT0
BECAUSE0
BELIEVE7
BETTER0
BILL27
BUT0
BY11
CAN0
CAN'T0
CARE0
CHANGE0
CHILDREN0
COMPANIES0
CONTROL3
COST43
COSTS23
COUNTRY0
COVERAGE0
DO14
DOESN'T14
DONE1
DON'T97
ECONOMY16
EVEN0
EVERYBODY0
EVERYONE0
EXPENSIVE4
FOR0
FREE11
GET0
GO10
GOING48
GONNA13
GOOD6
GOVERNMENT87
HAS3
HAVE0
HE20
HEALTH0
HEALTHCARE0
HELP0
HURT12
I84
IF0
I'M0
IN0
INCREASE16
INSURANCE0
INTO12
INVOLVED13
JUST13
KNOW13
LIKE12
LOT0
MAKE1
MANY0
ME5
MEDICARE16
MEDICINE11
MONEY14
MORE15
MUCH35
MY0
NEED0
NEEDS0
NO5
NOT44
NOW0
ON15
ONE20
OR1
OUR0
OUT0
PAY24
PAYING14
PEOPLE0
PROVIDE0
READ11
RIGHT0
SHOULD9
SO0
SOME0
SOMETHING0
START0
SYSTEM0
TAXES13
THAN0
THEIR9
THEM0
THERE0
THEY18
THINGS23
THINK68
THIS0
TOO48
UNINSURED0
UP4
US23
WANT35
WAY1
WE0
WELL14
WHAT21
WHEN0
WHO0
WILL34
WITH10
WITHOUT0
WORK33
WORLD0
WOULD6
YEARS0
YOU1


For data:


wordfor diff
ABLE13
ABORTION0
ABOUT0
ACCESS12
AFFORD29
AFFORDABLE15
ALL0
ANY12
ANYTHING0
ARE44
AS2
AT2
BECAUSE69
BELIEVE0
BETTER30
BILL0
BUT1
BY0
CAN9
CAN'T15
CARE0
CHANGE14
CHILDREN12
COMPANIES24
CONTROL0
COST0
COSTS0
COUNTRY20
COVERAGE24
DO0
DOESN'T0
DONE0
DON'T0
ECONOMY0
EVEN13
EVERYBODY12
EVERYONE28
EXPENSIVE0
FOR0
FREE0
GET22
GO0
GOING0
GONNA0
GOOD0
GOVERNMENT0
HAS0
HAVE86
HE0
HEALTH17
HEALTHCARE107
HELP21
HURT0
I0
IF6
I'M4
IN12
INCREASE0
INSURANCE42
INTO0
INVOLVED0
JUST0
KNOW0
LIKE0
LOT28
MAKE0
MANY14
ME0
MEDICARE0
MEDICINE0
MONEY0
MORE0
MUCH0
MY6
NEED45
NEEDS11
NO0
NOT0
NOW9
ON0
ONE0
OR0
OUR4
OUT1
PAY0
PAYING0
PEOPLE104
PROVIDE11
READ0
RIGHT7
SHOULD0
SO27
SOME21
SOMETHING45
START12
SYSTEM10
TAXES0
THAN19
THEIR0
THEM14
THERE21
THEY0
THINGS0
THINK0
THIS13
TOO0
UNINSURED20
UP0
US0
WANT0
WAY0
WE40
WELL0
WHAT0
WHEN13
WHO20
WILL0
WITH0
WITHOUT13
WORK0
WORLD15
WOULD0
YEARS11
YOU0

Saturday, March 13, 2010

Don't feed the animals


I took LLLL to the zoo last spring, and there we noted the following sign on the Monkey enclosure near the café:
Please do not feed us. We are on a special diet.

I didn’t realize that monkey diets were drastically different to humans ones, so I took a look at what they were eating:
Tomato, zucchini, melon, apple.
This didn’t look particularly special to me.
So I shrugged and went into the café.
I scanned the menu there: hot dogs, cheesecake, coffee, ice cream, meat pie, but not many vegetables. And I started to wonder.
Who was misfeeding whom?

Thursday, March 11, 2010

Is Twitter...

the heaven to which bloggers ascend after they die?